While working at Userspots, I created a lot of infographics to show research outcomes that involve both qualitative and quantitative data. Here are some examples.
Akbank Website
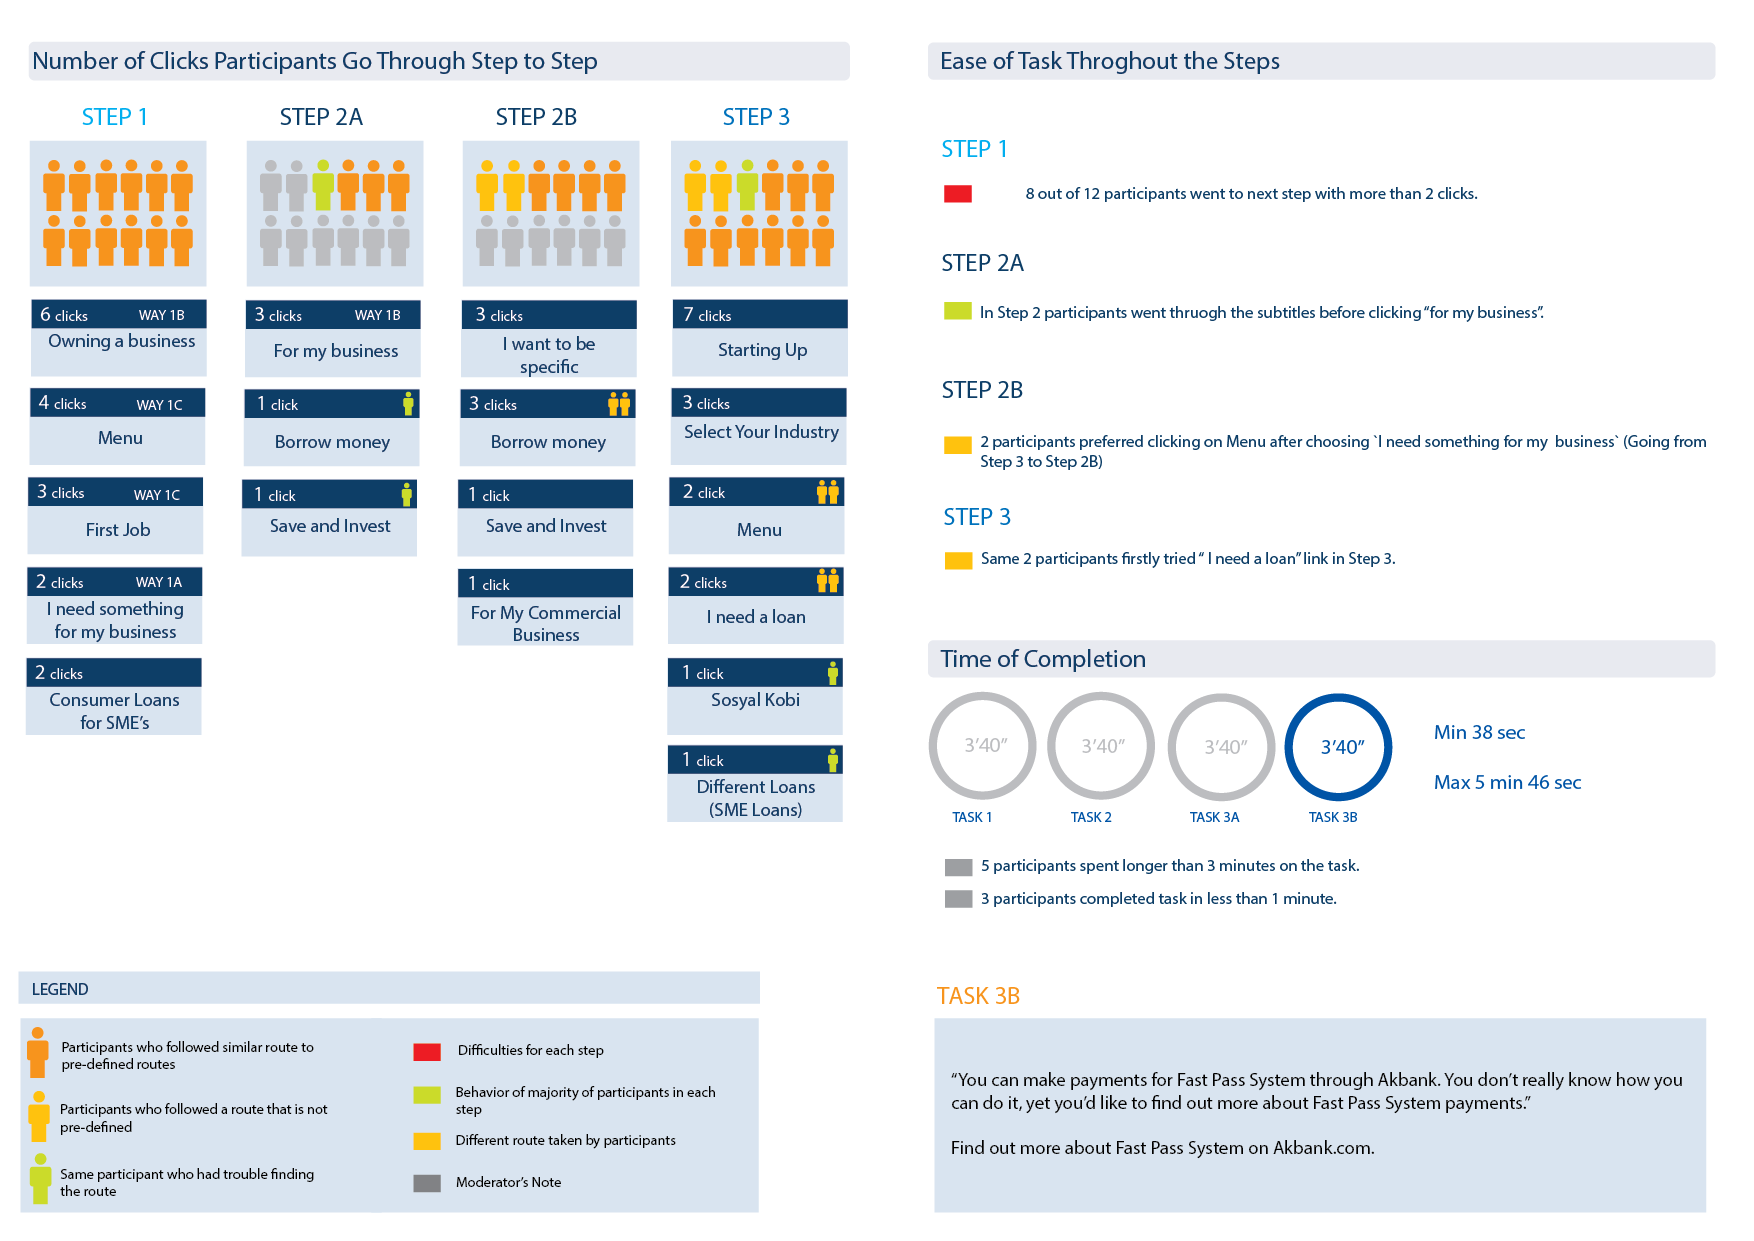
Akbank, one of the Turkey's leading banks, was re-designing their website and needed a prototype testing to understand if new menu and search bar structure works in terms of navigating through the website.
They needed a very detailed report including the task completion rates and number of clicks.
Sahibinden Ipad App
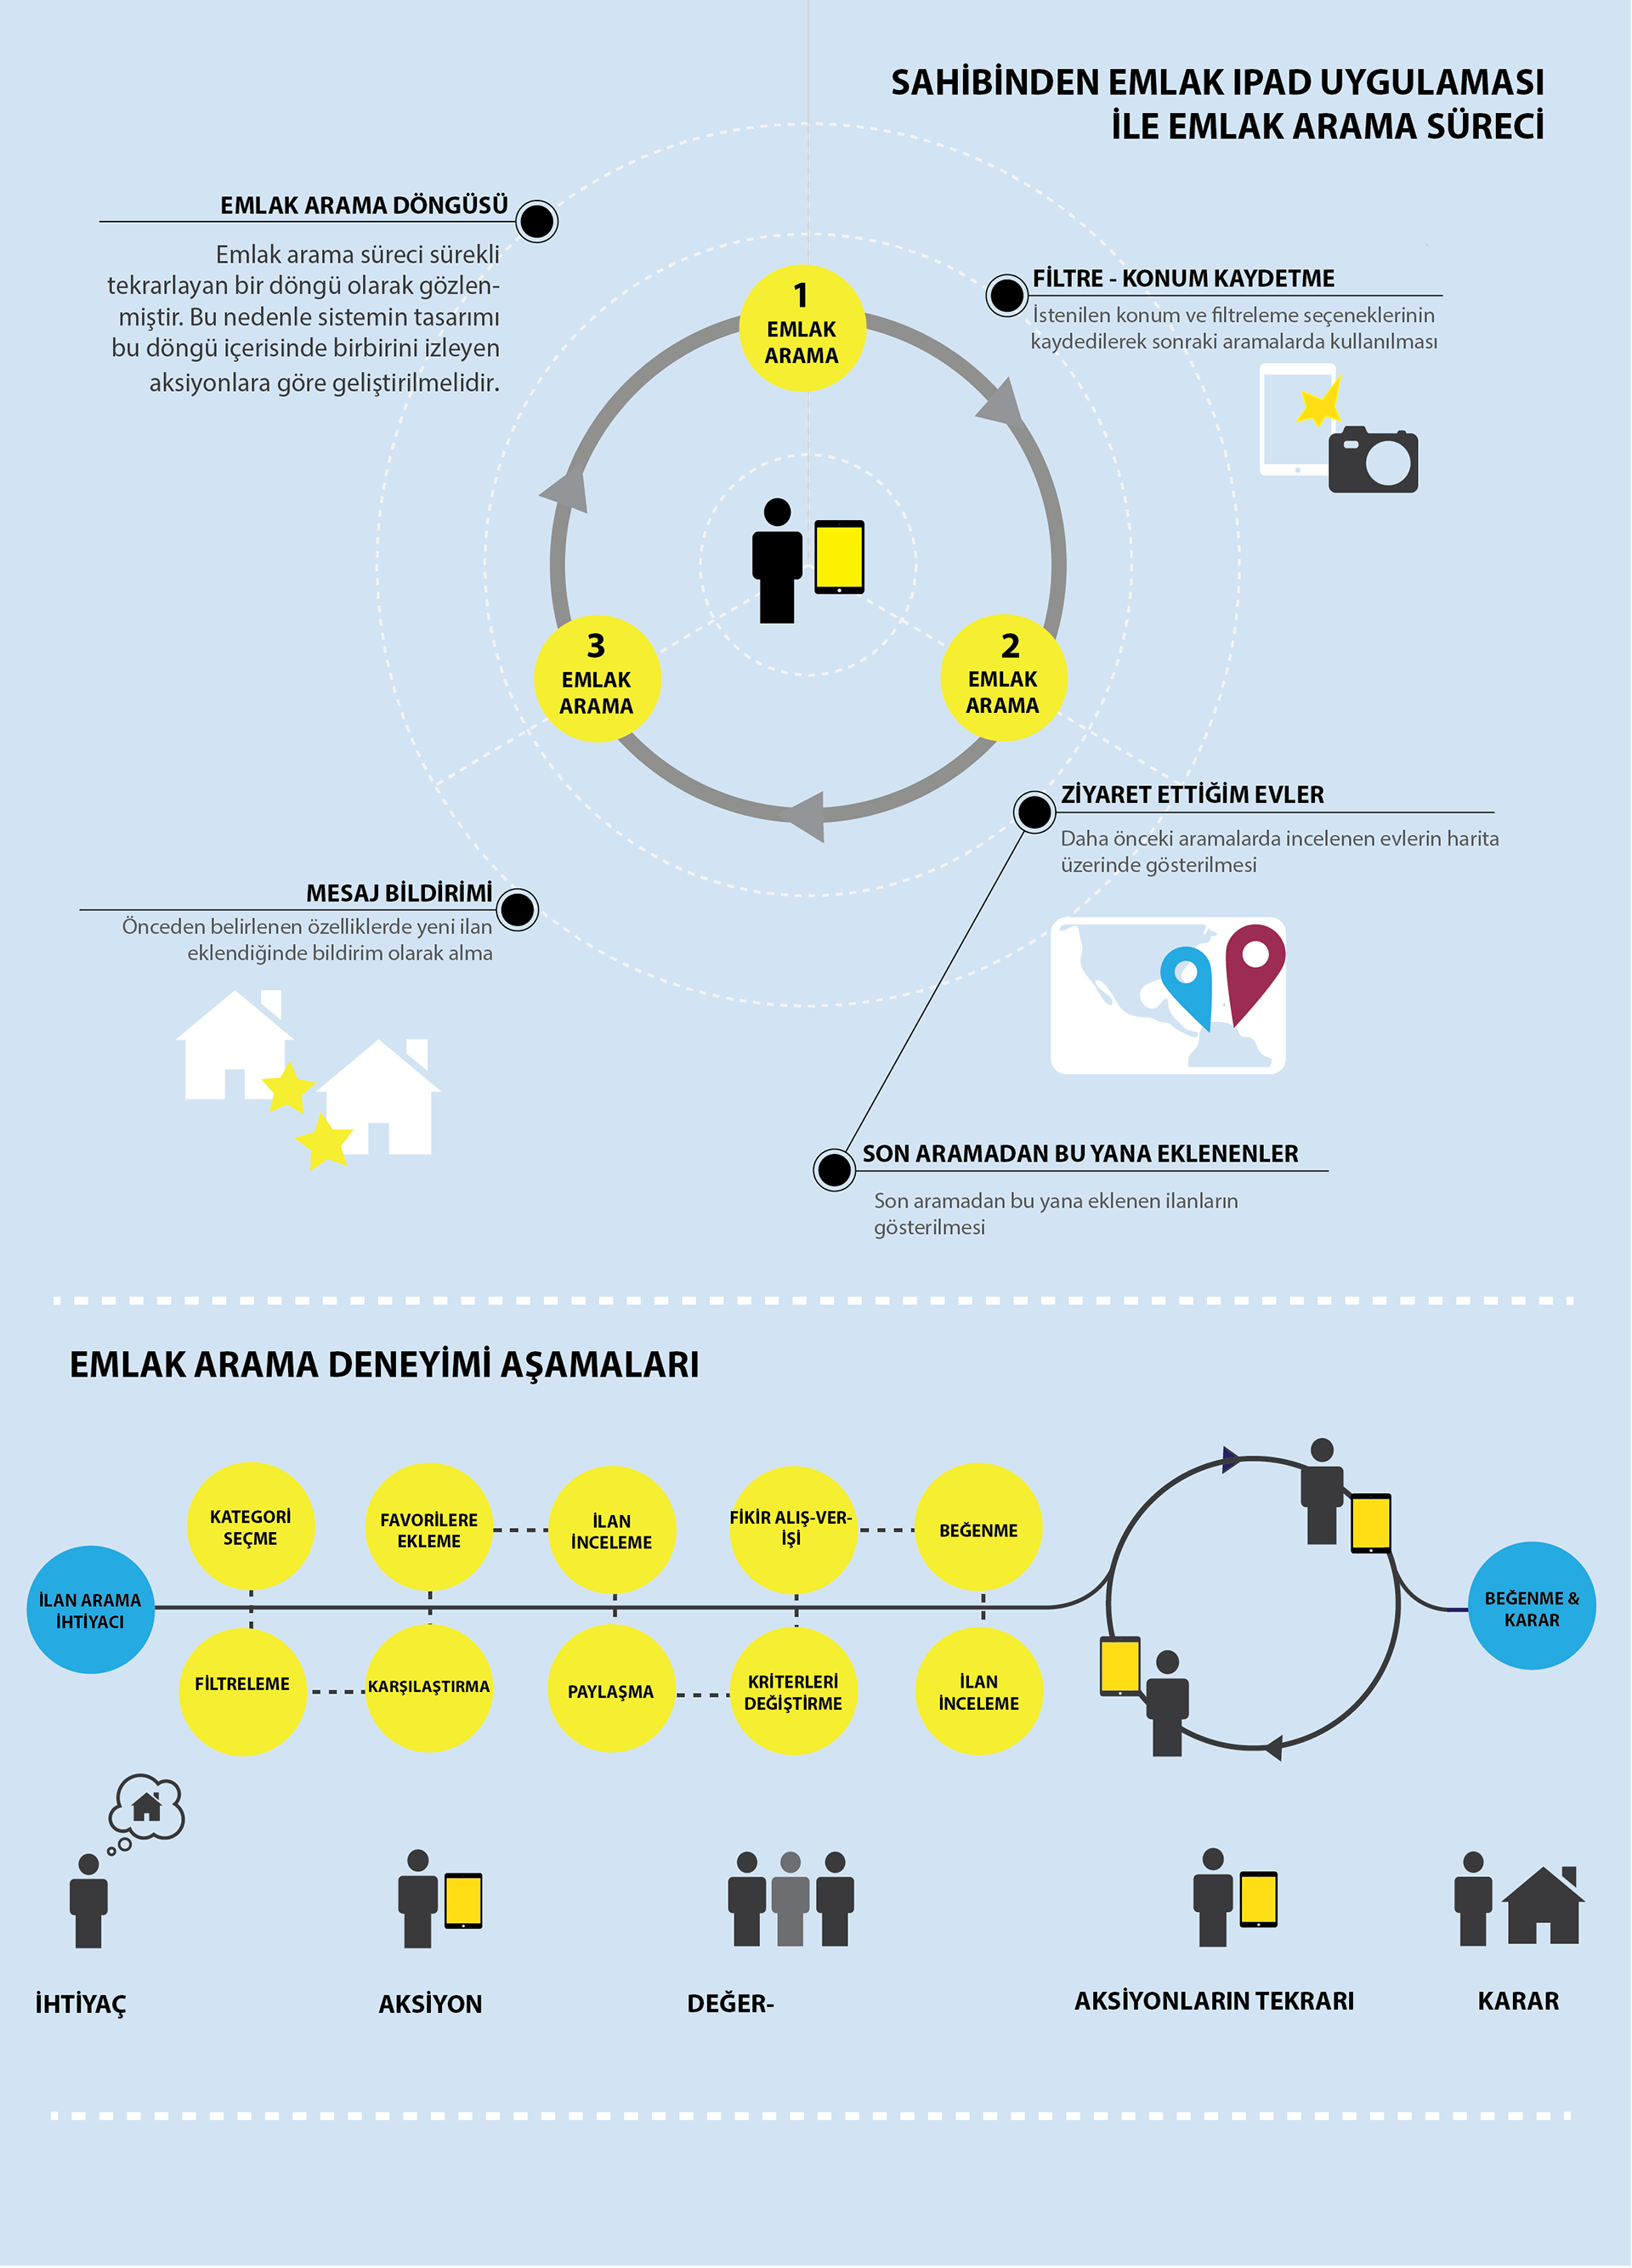
Sahibinden is Turkey's most popular classify platform, and my task was to conduct a usability testing for Ipad app. However, it ended up becoming a user journey output and new feature suggestions. Because we had right set of participants, I was able to capture the good insights and pain points during the tests.
Akbank Mobile
Akbank renewed their mobile app, and needed a quantitative data to see the improvements compared to old version and another banking app.
We used Single Usability Metric Method to communicate the results in a more quantified way.
